Use Google Docs to Create Pie Charts and Graphs
There are web based tools to create pie charts, bar graphs, Venn diagrams, Flow charts and other graphical representations. Web based apps are great and offer great designs and patterns but there is a little problem with the data and recursive editing.
Google Docs Vs Web Based Apps
Consider you are creating a project report and want a line graph from a set of data. You head over to a website which lets you create charts and create the chart as usual. After some weeks, if you want to modify the chart – you have to start all over from scratch. You may lose the data used in the chart, if you haven’t saved it in an excel spreadsheet.
Google docs has a slight edge because you can store the data in an excel spreadsheet, create the chart and download the image in your computer. Later, when you want to add, edit or remove data from the chart, just edit the spreadsheet and the change will be automatically reflected in your chart. (Tip: Use Google docs as a Blogging tool)
How to Create Charts and Statistics using Google Docs
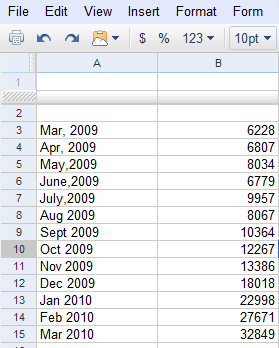
1. Open Google docs in your browser and create a new spreadsheet. Enter your data in columns as shown below
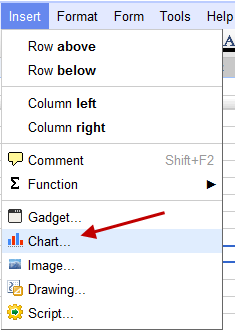
2. Click “Insert” from the “Menu” and select “Chart” from the options.
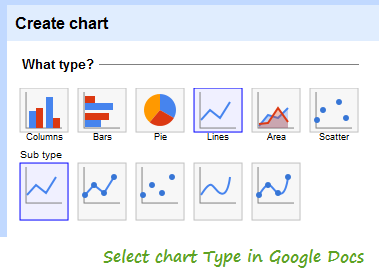
3. This will open the “Create Chart” editor window where you can select the type of hart you want to create. Select the “Type” and the “Sub Type” from the available options
- Columns
- Pie Charts
- Bar Graphs
- Area
- Scatter points
4. Next, select the range of data which you want to use in the chart which you are going to create. Simply click on a cell on the spreadsheet and drag the cursor to make a selection.
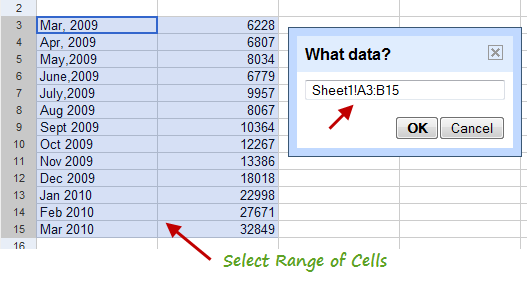
Remember to group data by rows or columns according to your need.
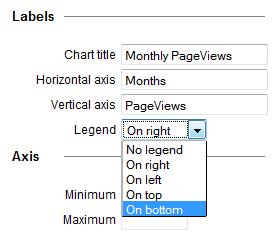
5. In the next step, enter the labels of the horizontal and vertical axis and give your chart a name. You can choose to show the legend on top, right, left or bottom of the chart.
6. You are all done. Hit “Save chart and the chart will be embedded in the spreadsheet right away. You can then save the chart as an image in your computer.
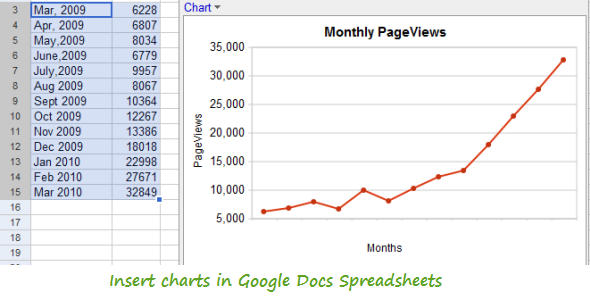
Following is a sample chart made using Google docs spreadsheet. The data reflects the monthly pageviews of Ampercent from May 2009 to March 2010.
Please note that the chart won’t be available to other office applications if you download it and try with OpenOffice or Microsoft Office. The same thing can be achieved with Microsoft excel but I will prefer using Google docs since the spreadsheet is stored in the cloud and can be accessed from multiple computers.
Using Google Docs to Create a Simple Survey Form
Above you learned how to create charts in Google Docs. If you have a website or a blog and want to get feedback from your website visitors or a group of people about your latest project, use Google docs to create a simple survey form in your website.
Then you can embed the survey form in your website and gether information from different users in an Excel spreadsheet. The advantage of the form is that you can combine the user generated data in the spreadsheet to create charts, diagrams or bar graphs as shown earlier in this tutorial.