Create pie charts online with Free tools
Anybody using Microsoft office can create bar graphs using Excel 2007.But what about pie charts ? There are so many useful websites that let you create pie charts online for free.You do not need any software and it’s so easy that even your mom can get the job done in minutes
Earlier we have discussed how to create pie charts-Bar graphs and venn diagrams with online free tools. Here are some of the more pie chart creation tools for you
Charttool : The most flexible online chart generation tool i have seen.You can create pie charts,line charts,bar charts and radar plots with charttool (see example).
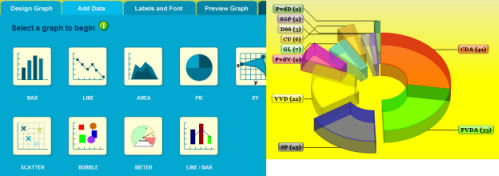
You can edit or access your charts later if you have signed up for an account.After creating your charts you can download the charts in your computer in popular image formats like PNG,JPEG. It also supports generating a PDF or CSV of your charts so if you have a large number of fields to be used this service is recommended.The charts thus created can be shared using email.
Chartpart : Chartpart is a website that can be used to create pie charts online.You can create 3d pie charts,line graphs,stacked bars,side grouped bar,scatter plots,grouped bars and Venn diagrams using Chartpart.
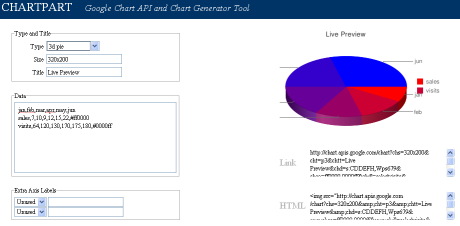
At first select the type of pie chart that you want to create and enter your data in the data box. The resulting pie chart is generated in your right as you enter the data.After you have finished creating the chart you can embed the chart in your blog or website by adding a small piece of code. The chart can also be shared with anyone as every chart generated has a Unique URL.
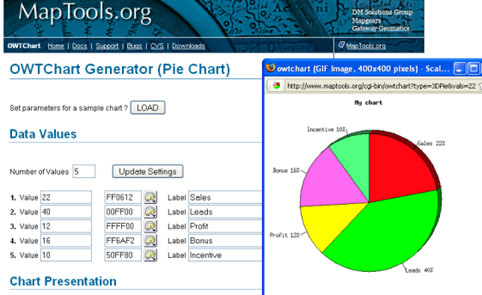
Maptools : Maptools is the simplest website to create pie charts online. You can create pie charts,bar graphs and multi set bars using this website. Just select the number of fields of your chart, assign a color for that field and set it’s value. Your chart is created instantly which you can save in your computer as an image.
The downside is that your chart is not stored online so you cannot directly share it with anyone or embed it in your blog or anywhere else.
Yellow pipe Pie chart generator
Yellow pipe is another simple pie chart generator web app.Select the number of input fields,select the color of the fields and assign the data. The chart is generated which you can save as an image in your computer
Also do check out some of the interesting Free tools at Yellow pipe
Develop a Pie chart using Google chart API
If you want to go with google then you can generate dynamic charts using the Google charts API. Open a new browser window and paste the following in your address bar
http://chart.apis.google.com/chart?cht=p3&chd=t:20,40,25,15&chs=250×100&chl=Field1|Field2|Field3|Field4
Here you need to supply the values of the Fields as shown by 20,40,25 and 15 separating each of them with commas. At the end of the URL separate the name of the fields with a pipe (|).The example can be found here
