Embed Real Time analytics in your Website
A good sales page is a key to marketing success for any brand. And when we talk about a good sales page, we have to mention the site demographics like pageviews, visits, country specific results etc. This ensures the advertisers get a clear idea of your reach. But showing them as an image is somewhat tedious as you need to update it regularly to keep your sales page accurate. But would’t it be great if we could simply add the chart once and it gets updated on its own as soon as the stats change ? I know the idea is great.
![]()
Embed Real Time Analytics is an online tool that can generate HTML codes from your Google Analytics data using which the Analytics data can be shown on your website or blog as a live chart. Let me show you how you can embed real time analytics on your website or blog using this tool.
Signup and Grant Access to Google Analytics :
1. Go to the signup page and register for a free account.
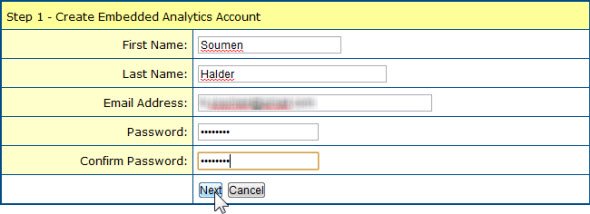
2. After you press “Next” you will be asked to grant this app access to your Google Analytics account. You do not need worry about the privacy though, as it won’t have an access to the account and you can revoke Google analytics access to the app at any point of time.
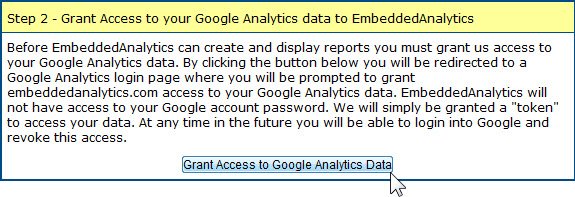
3. You will be asked to login using your Google Account that you use for Google Analytics.
4. After you login press the button “Grant Access” to grant access to this app. Once you do that, you will get redirected to Embedded Analytics Account homepage.

How To Create, Customize And Embed A Chart on Your Website :
1. You can create two types of demographics using this tool.
- Embedded Chart : To use this go to Products > EmbeddedCharts or you could use this link (keep logged in).
- Embedded Stats : Go to Products > EmbeddedStats or use this link while logged in.
2. Now I will be showing you how to create a chart against your analytics data and embed it on your website or blog. To do that go to the Embedded Charts sections (use the link provided earlier).
3. In the Embedded Charts page, you will find a link named “Sample Reports”. Click that which will take you to the page where some sample reports have been demonstrated. Once you are there, you will find another link (above every sample charts section) which says “Create Chart Against My Data”. Well this is the link that we will be using to create our chart. I was a bit annoyed that guys back there did not provide a direct link. (You could use this direct link).
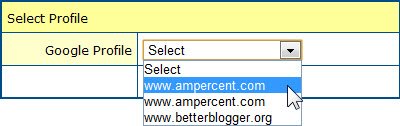
4. If you have multiple profiles under your Google Analytics Account then choose the profile you wish to create the chart for and press the button “Create Chart”.
9. As the page loads you will see a chart of your Google Analytics data getting materialized. At first, you will notice a chart that is pretty basic and is generated by default. You will get a customization panel following the chart using which you can customize the metrics, time frame and appearance (fonts,colors etc) for the chart to meet your needs.
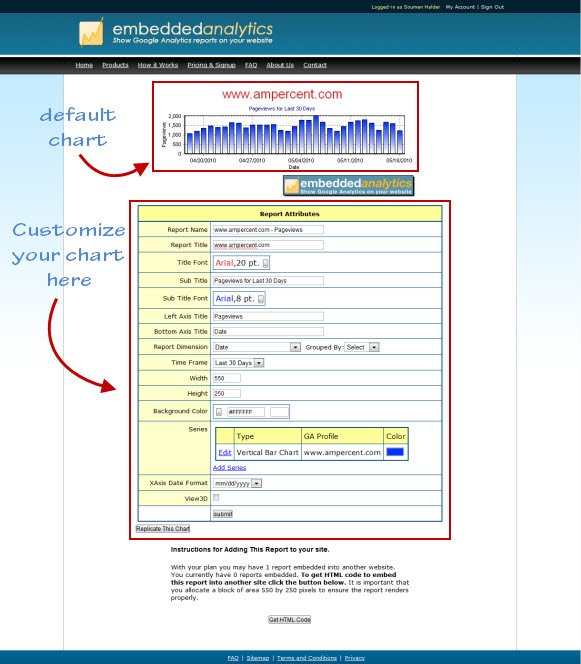
10. I am not going to comment on other customizations, you choose what is best for you. I will be showing how to edit the metric / dimension part only. Scroll down to the section which says “Series”. You will find a link “Edit”. Click that.

11. Now you will be able to change the metrics for the chart. Switch to values which suits your requirements. Once you are done press the submit button.
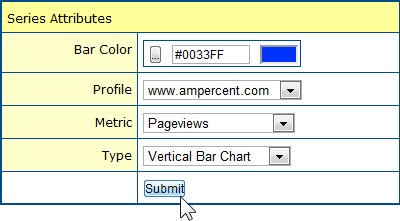
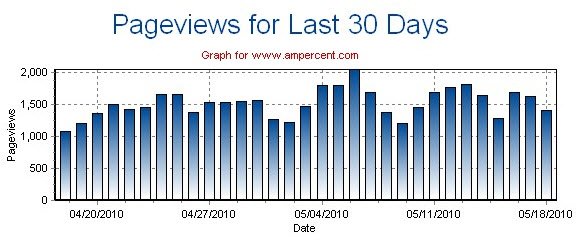
12. Once you are all set, press the button “Submit”. Now scroll down to the end of the page and hit the button “Get HTML Code”. Once you get it, copy it and paste the code on your webpage wherever you are willing to. You can take a look at the live chart created for Ampercent over pageviews (for last 30 days) metric on our sales page or here is a screenshot of that.
Pricing :
The tool has both free and paid versions. The paid version costs $19.95 (as on 18th May’10) for one year. It has support for 5 charts. The free version on the tool has support for only 1 chart. The free version also includes a promotional banner on the chart which can be removed in the paid version. For more information on pricing please visit their pricing page.
So, I guess from now on you can use this app to make an exact sales page. If you know of any such free tool that serves the same purpose please let us know. And also comment if this tool has helped you solve a problem. Happy Blogging !!!